
DS-Alert System: DYMEX models for pest management
DS-Alert System: DYMEX models for pest management
Description
Process-based population dynamics models for three fruit fly species (Bactrocera dorsalis, Bactrocera zonata, and Ceratitis capitata). These models can be used for:
- Understanding the population drivers in different weather contexts.
- Strategising management of the pests.
- Understanding the benefit:cost of different management tactics.
The models are extensible, to explore topics of interest to clients. Models can also be developed for other species.
Background
This tool demonstrates the potential value of using ecophysiological modelling to forecast the severity of a pest problem and to help guide management decisions. DYMEX (Maywald et al. 2007) models (version 4.1) were crafted to simulate process-based population dynamics of three fruit fly species (Ceratitis capitata and Bactrocera dorsalis). A model is well-advanced for Bactrocera zonata, but further work is necessary to complete it.
DYMEX is a powerful software package for developing and running deterministic population models of biological organisms. DYMEX’s modelling approach involves the construction of a model for the pest of interest from individual component modules, processes, and functions. The two DYMEX models shown below, were constructed to simulate the development and spread of the fruit-flies Bactrocera dorsalis and Ceratitis capitata, on a daily time-step. For each model, the main core was the development of the lifecycle of the pest, which is composed of life-stages through which each individual passes during its life. Based mainly on laboratory studies of their thermal biology, algorithms were developed to simulate the progression of either Bactrocera dorsalis and Ceratitis capitata through different life stages (egg, larva, pupa, adult) based on temperature, and other environmental variables. Data from the FF-IPM experimental work and literature were used for the construction of the algorithms. The models were validated against data gathered during the FF-IPM project to ensure their accuracy and reliability in simulating B. dorsalis and C. capitata population dynamics.
The models can provide real-time updates and forecasts based on current environmental conditions and pest population dynamics allowing the exploration of different management options for each of the pests. The outputs can also be used as a tool to determine the time and location of a possible outbreak of the pest.
Trap catch data were used as a biofix with which to initialise the DYMEX models for Ceratitis capitata and B. dorsalis at different locations. Using weather data at these locations, the models enabled us to estimate how population growth was likely to proceed over the next season.
Ceratitis capitata DYMEX model.
Trapping data for Ceratitis capitata from conventional traps for the entire pilot site in Macedonia, Greece (Fig. 1) were gathered during the period of about three years (June 2020 – Dec 2023) as part of the FF-IPM project.
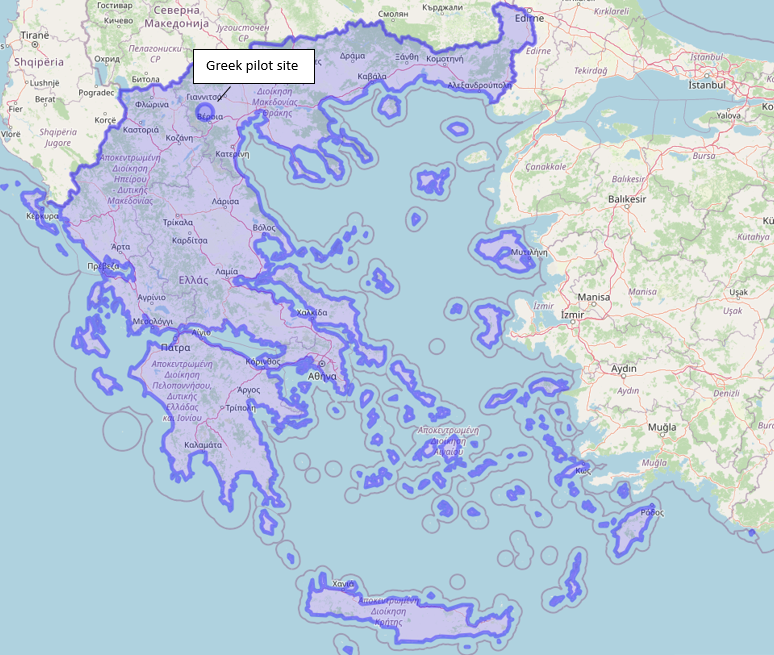
Figure 1 Map of Greece showing the location of the pilot site where the trapping data were gathered during the FF-IPM project and used for the DYMEX simulations.
The elevation of this area is close to 0m above sea level, but the climatic conditions in winter are not favourable for the development and growth of Ceratitis capitata populations. Nevertheless, the pest can survive the harsh winter climatic conditions in the larva stage [1] during that period.
Simulation data were derived from the DYMEX model for the period of June 2020 – Dec 2023. For this simulation, ERA5 meteorological data for a location in Macedonia, Greece were used. The model was run from 1 April 2020 to 31 December 2023 and it was initiated with 500 larvae at the beginning and once every year, to simulate the overwintering of larvae in infested fruits in early April.
Results
Figure 2 shows the simulations of the DYMEX model for Ceratitis capitata along with the trapping data. It can be seen that the phenology of Ceratitis capitata is captured quite well by the DYMEX model.
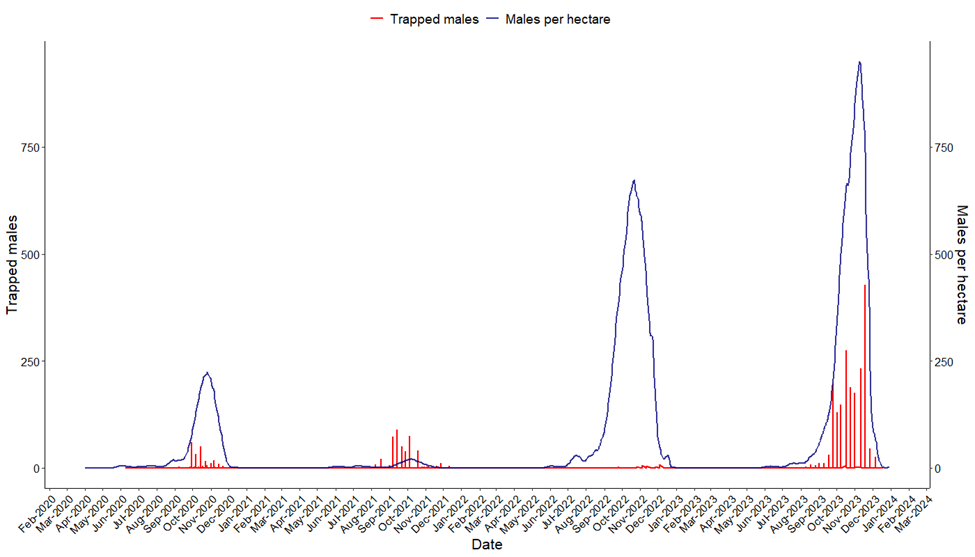
Figure 2 Simulation results derived from the DYMEX model for Ceratitis capitata in Macedonia, Greece. Blue line shows the number of the simulated Male population per hectare, while red bars show the number of the trapped males during the same period.
The differences in amplitude between the trap catch data and the modelled abundance are complex, including the intensity of management efforts and the abundance of flies being introduced into the area from elsewhere. However, the consistency between the observed phenology and the simulations from the DYMEX model highlights the robustness of this tool. The models can accurately represent the seasonal dynamics of the pests and can be applied in diverse environmental settings. They can be used as tools to forecast varying climatic scenarios across different geographic locations.
Bactrocera dorsalis DYMEX model
Trapping data from conventional traps from three pilot sites, Nelspruit, Ermelo and Schoemanskloof (Fig. 3) were gathered during the period of two years (Oct 2020 – Oct 2022) as part of the FF-IPM project.
The three sites in South Africa are characterised by the different elevations (Nelspruit: 644m, Schoemanskloof: 1276m and Ermelo 1,700m above sea level.).
Simulation data were derived from the DYMEX model for the same period.ERA5 meteorological data for each of the three locations in Mpumalanga province locations in South Africa were used. The model was run from 1 October 2020 to 30 October 2022 and was initiated with 100 males and 100 females.
Figures 4-6 show the simulations of the DYMEX model for B. dorsalis along with the trapping data.
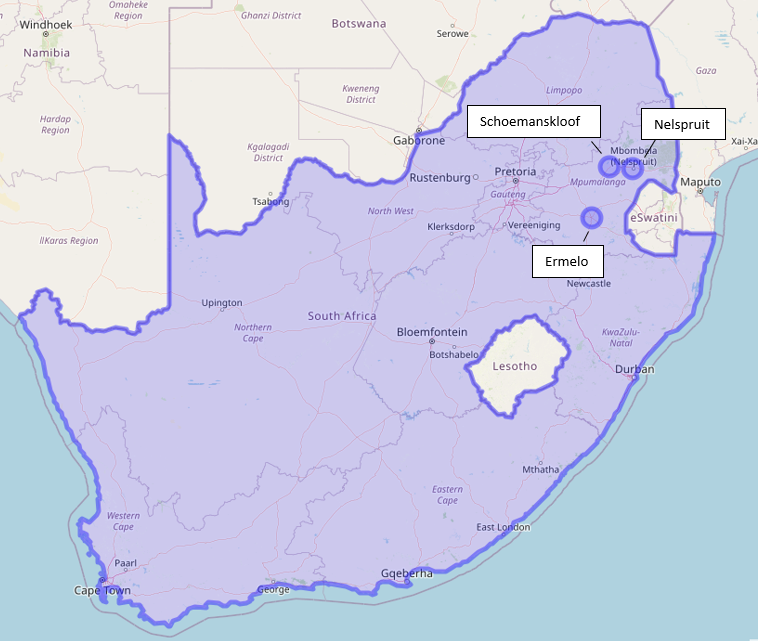
Figure 3 Map of South Africa showing the three pilot site locations where the trapping data were gathered during the FF-IPM project and used for the DYMEX simulations. In Figures 2-4, it can be seen that the phenology in all three sites is captured relatively well by the DYMEX model for Bactrocera dorsalis.
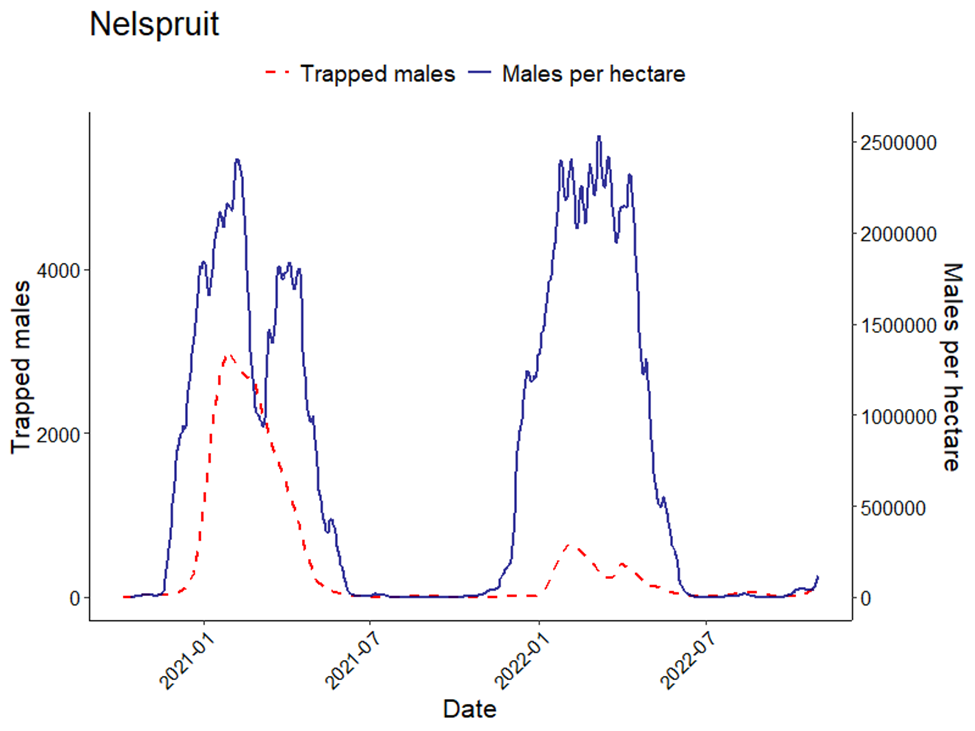
Figure 4 Simulation results from the DYMEX model for Bactrocera dorsalis in Nelspruit. Blue line shows the number of the simulated Male population per hectare, while the red dashed line shows the number of the trapped males during the same period.
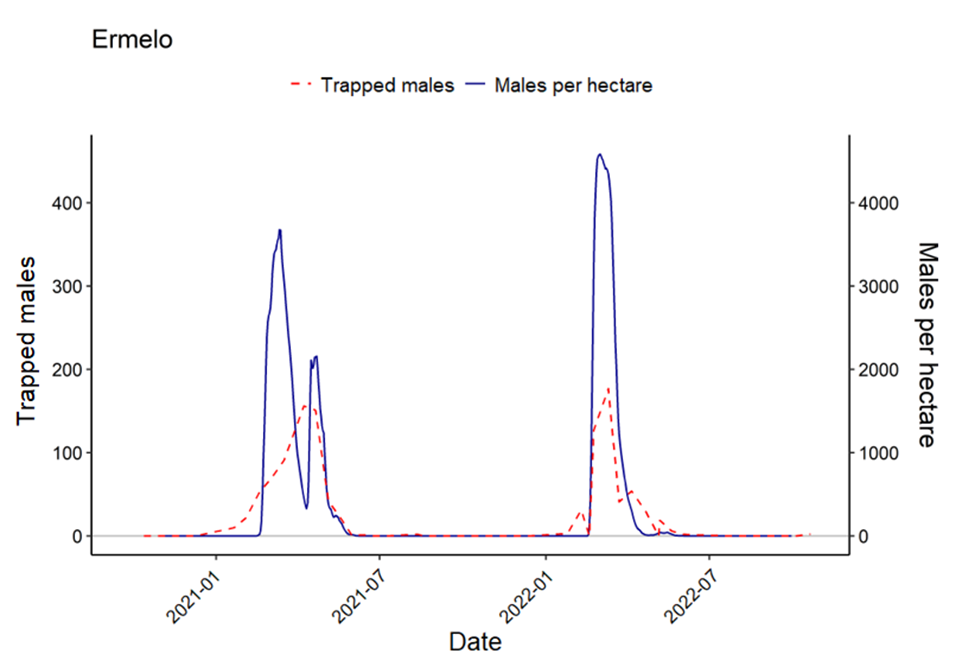
Figure 5 Simulation results from the DYMEX model for Bactrocera dorsalis in Ermelo. Blue line shows the number of the simulated Male population per hectare, while the red dashed line shows the number of the trapped males during the same period.
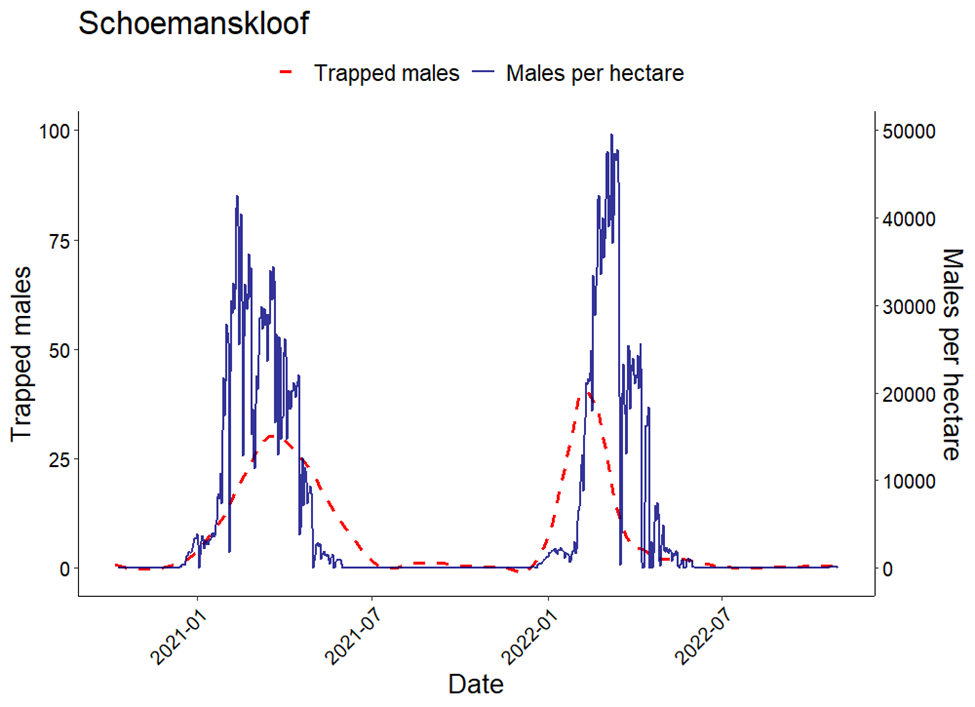
Figure 6 Simulation results from the DYMEX model for Bactrocera dorsalis in Schoemanskloof. Blue line shows the number of the simulated Male population per hectare, while the red dashed line shows the number of the trapped males during the same period.
References
[1] Papadopoulos, N T, J R Carey, B I Katsoyannos, and N A Kouloussis. Overwintering of Ceratitis capitata (Diptera: Tephritidae) in northern Greece. Ann. Entomol. Soc. Am 89:526–534.1996.
Pricing
If you are interested in us developing a DYMEX model for another species for you, running management scenarios or climate change scenarios or developing different products, please contact us here. For further information, please visit www.cervantesagritech.com.
References
Maywald GF, Kriticos DJ, Sutherst RW, Bottomley W (2007) Dymex Model Builder Version 3: User’s Guide. Hearne Publishing, Melbourne.
Keywords
FF-IPM Developed, Tools, DYMEX, Population dynamics models, Post-border, Pest management
Additional information
| Language | English |
|---|---|
| Person Responsible | Eleni Verykouki, Darren Kriticos, Anna Szyniszewska and Tania Yonow |
| Document(s) |


Reviews
There are no reviews yet.